Tracking vulnerabilities is only part of the equation. To improve security over time, you must measure how effectively you manage risk. That’s where vulnerability management metrics come into play.
These key performance indicators (KPIs) reveal if remediation efforts match threats, highlight gaps in visibility or prioritization, and help you demonstrate progress in a language both technical and business leaders understand.
The right metrics help you fix the issues that increase risk, not just tick boxes. Here’s how to find and use them.
What Are Vulnerability Management Metrics?
Vulnerability management metrics are quantifiable signals that reflect how effectively your organization identifies, prioritizes, and reduces security risks across its infrastructure. These are the foundation of any meaningful vulnerability management reporting strategy. From tracking the average time to detect vulnerabilities to understanding how many critical issues remain unresolved, these metrics help security teams gauge their progress and fine-tune their approach.
At a deeper level, these metrics function like diagnostic tools. They show you which parts of the process are working and which need attention—whether that’s a backlog of high-risk vulnerabilities, low patch compliance, or a rising rate of reopened issues.
By continuously measuring performance with the right vulnerability management KPIs, you gain a sharper view of your overall risk posture and a more straightforward path toward improving it. And when leaders and stakeholders ask for proof that your program is making an impact, these numbers give you the story to tell.
Why Are Vulnerability Management Metrics Important?
Vulnerability metrics translate complex technical risk into something tangible for internal teams and business leaders. Instead of relying on vague assumptions or endless scan results, these metrics indicate what’s working, what’s lagging, and where to focus next. This helps security leaders prioritize remediation by risk, not just volume—while giving DevOps and infrastructure teams the context needed to act fast.
For a vulnerability management program to succeed, it needs a way to measure outcomes. Metrics like vulnerability remediation tracking or breach exposure trends can show whether your organization is closing gaps or letting critical issues slip through. Without these insights, reporting often turns into guesswork, and that’s when risk quietly accumulates.
KPIs and other metrics also simplify communication with stakeholders by turning progress into measurable business value. That’s especially useful when producing a credible vulnerability report for audits, compliance, or board-level updates.
Top 15 Vulnerability Management Metrics
Tracking the proper metrics shows you where risk lives, how fast your team responds, and which parts of the remediation process need work.
Below are 15 key vulnerability management KPIs to help you measure progress, increase security posture, and communicate impact effectively.
1. Mean Time to Detect
Mean time to detect (MTTD) captures how long it takes to spot a vulnerability after it enters your environment. A lower MTTD means scans and monitoring tools work seamlessly and you catch risks before attackers can exploit them. Extended detection windows could point to blind spots or gaps in coverage, especially in fast-moving development pipelines.
2. Mean Time to Remediation
Mean time to remediation (MTTR) reflects how quickly your team fixes a vulnerability once discovered, showing how effectively you close risk. Long remediation cycles can expose high-value assets and erode stakeholder confidence. MTTR also ties directly to service level agreement (SLA) compliance.
3. Average Vulnerability Age
This metric tells you the average lifespan of vulnerabilities from discovery to closure. An increasing trend here could mean your backlog is growing or teams struggle to prioritize fixes. It’s one of several cybersecurity KPI examples that indicate the health of your remediation workflows.
4. Risk-Based Vulnerability Scoring
Go beyond the Common Vulnerability Scoring System (CVSS). Risk-based vulnerability scoring blends business context, asset importance, exploitability, and threat intelligence to show which vulnerabilities matter most. It avoids wasting time on low-impact issues and focuses remediation where it counts.
5. Recurring Vulnerabilities
When the same vulnerability pops up on the same system or returns after a patch, it usually signals configuration drift, weak testing, or gaps in DevSecOps. Monitoring recurrence helps root out systemic issues and improve long-term resilience.
6. Vulnerability Re-Open Rate
The vulnerability re-open rate shows how often teams mark vulnerabilities as resolved but reopen them due to patch failure or misconfiguration. High rates here can indicate quality assurance (QA) weaknesses or tooling misfires, which may require closer alignment across teams.
7. Scan Coverage
You can’t secure what you’re not scanning. This metric shows how thoroughly your team scans infrastructure, cloud assets, and more. Pair this with scan frequency and depth for a complete view of risk visibility. Strong scan coverage gives you a full view of the attack surface.
8. Number of Open High-Risk Vulnerabilities
This number tracks unresolved vulnerabilities with critical severity levels. If it stays high, your team may struggle with prioritization or resourcing. Trends over time reveal if risk is compounding or decreasing.
9. Time to Patch
Speed is everything for zero-days and actively exploited vulnerabilities. So unlike MTTR, time to patch measures the lag between patch release and deployment. Teams often include this metric in patch management KPIs and track it by severity and asset type.
10. Percentage of Critical Systems Patched
This metric shows how well your team protects your most vital assets. Even a handful of unpatched critical systems can introduce significant risk, making the percentage of critical systems patched ideal for inclusion in executive dashboards and vulnerability reports.
11. Total Risk Remediated
Beyond counting vulnerabilities, total risk remediated quantifies the risk reduction achieved through your actions. This KPI is a smart way to translate technical effort into business impact, especially when aligned with goals from application risk assessments.
12. Asset Inventory Accuracy
When teams miss systems during scans or use outdated records, they generate flawed risk data—but accurate asset inventories are foundational to any vulnerability management program. Inventory metrics support secure development practices, especially in organizations aiming for a secure SDLC.
13. Patch Reversal Rate
Sometimes patches break things. The patch reversal rate tracks how often teams roll back updates due to conflicts or bugs. A high reversal rate can expose testing gaps or process breakdowns, especially in fast-paced CI/CD environments.
14. SLA Compliance Rate
When your policy requires fixing critical vulnerabilities within seven days, this KPI reveals if your team is meeting that goal. SLA metrics are valuable when benchmarking teams, vendors, or business units.
15. System Hardening Level
Hardening KPIs show how securely your team has configured systems to defend against common threats. This includes enforcing secure defaults, limiting admin privileges, and minimizing unnecessary services. It’s a proactive measure that complements vulnerability scanning.
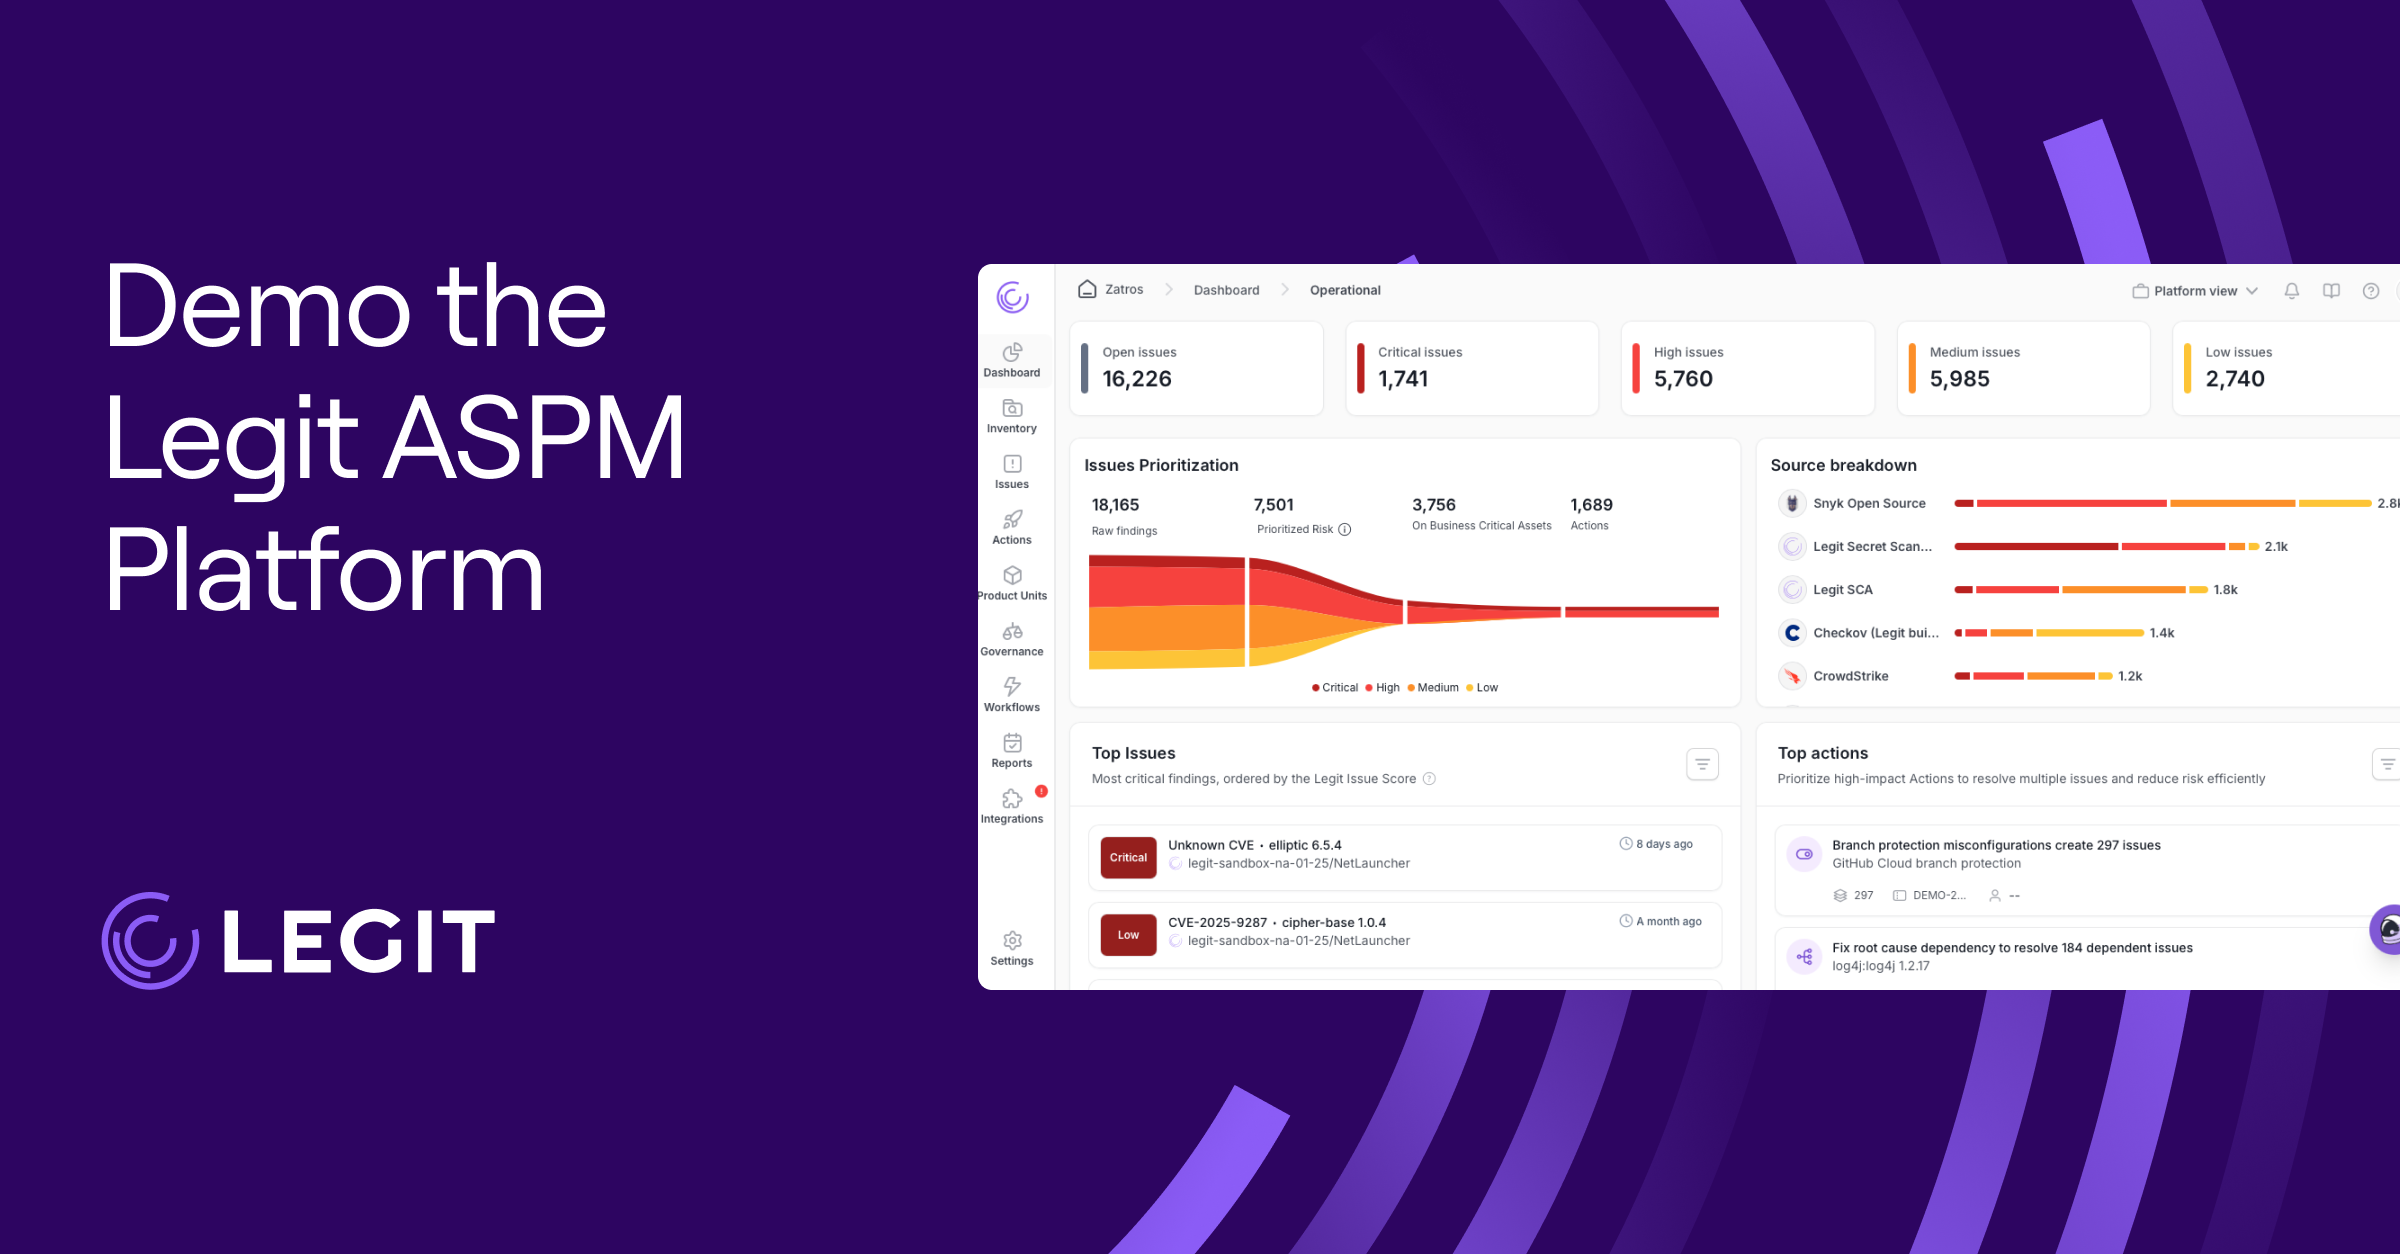
Monitor Vulnerability Management Metrics With Legit Security
Many of these metrics reflect the principles outlined in top vulnerability management best practices and tips, especially when used to strengthen prevention strategies. But they’re hard to track without a clear system.
Legit Security helps you go beyond collecting metrics by giving you actionable insights tied to business risk. With full visibility into your pipelines and development environments, you can monitor the metrics that matter, like SLA compliance, time to remediation, and high-risk exposure. Legit also helps reduce early-stage risk by detecting secrets in code and applying security controls earlier in the SDLC.
Download our new whitepaper.